The Equality Act 2010 (Gender Pay Gap Information) Regulations 2016 came into force on 1st October 2016 requiring all employers who employ 250 or more employees to publish, on their website, their overall mean and median gender pay gaps.
Great Places provides Gender, Ethnicity and Disability pay gap reports and uses this information to help inform our actions around these areas. Although both Ethnicity and Disability pay gap reporting are not a legislative requirement, we recognise the importance of understanding our pay gaps in these areas, and are voluntarily reporting these as part of our wider commitment to equality, diversity, inclusion and belonging.
This report summarises the data for all eligible permanent or fixed-term employees of the entire Great Places Housing Group structure. This includes Plumlife, Cube and Hive Homes.
Having a pay gap does not necessarily mean that as an organisation we have acted inappropriately or in a way that is discriminatory. Rather, it helps us identify areas of the business where further action can be taken to redress the balance and explore opportunities for positive action.
We are voluntarily publishing:
The median is the middle value and is calculated by organising all the hourly rates of pay in order and selecting the middle number.
The mean is our average pay and is calculated by adding up all our hourly rates of pay and diving by the number of colleagues.
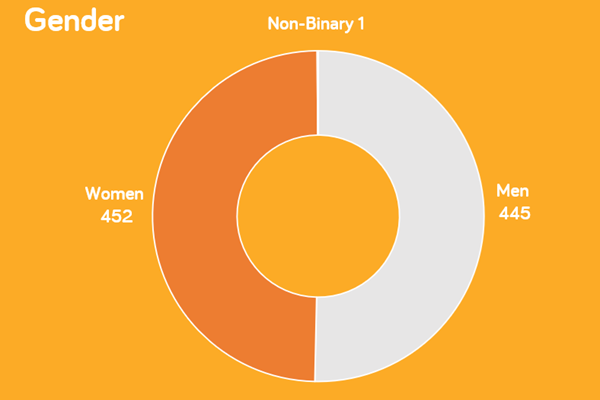
On the 5th April 2023, we employed 898 permanent or fixed-term colleagues.
All colleagues disclosed their gender: 452 (50.4%) were women, and 445 (49.6%) were men.
One colleague identifies as non-binary and therefore is not included within the gender pay gap calculation.
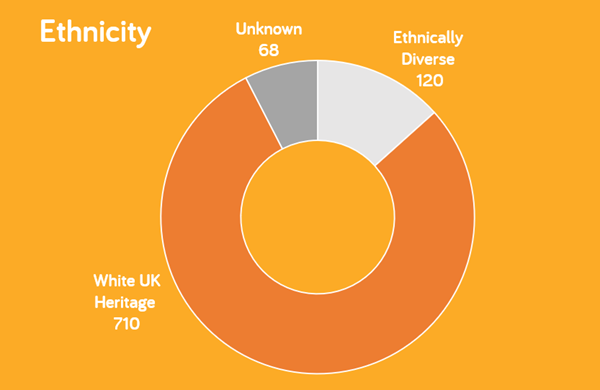
830 (92.4%) of colleagues disclosed their ethnicity data: 120 (13.4% of colleagues) were ethnically diverse, and 710 (79.1%) were of white UK heritage.
The pay gap figures for ethnicity exclude the 68 (7.6%) of colleagues that have not declared their ethnicity.
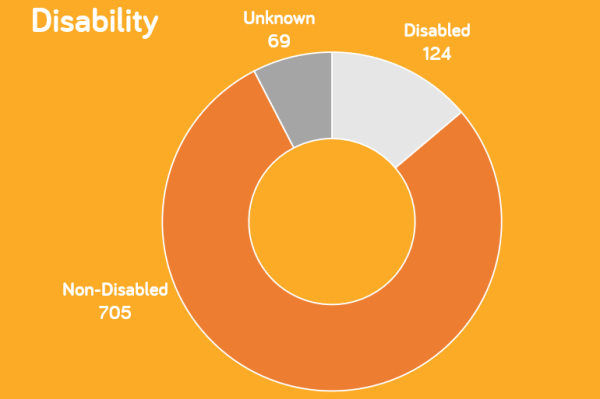
829 (92.3%) disclosed their disability data: 124 (13.8% of colleagues) declared a disability or long-term health condition, and 705 (78.5%) said they did not have a disability or long-term health condition.
The pay gap figures for disability exclude the 69 (7.7% of colleagues) who have not declared their disability status.
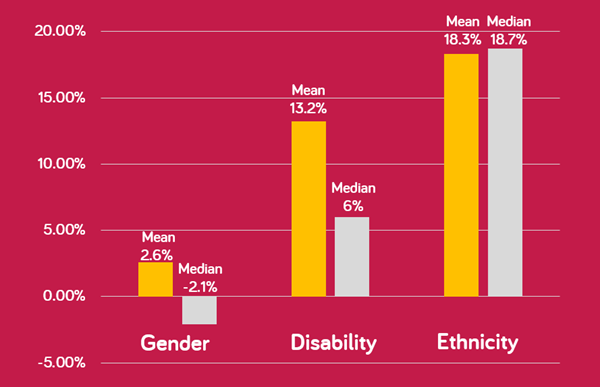
Our largest pay gap relates to Ethnicity (18.3% Mean and 18.7% Median), with the smallest pay gap relating to Gender (2.6% Mean and -2.1% Median). The Disability pay gap is in the middle (13.2% Mean and 6% Median).
The graph shows that with the exception of the Median Gender pay gap figure, the gaps show the marginalised groups are paid less than their other colleagues (i.e. men are paid more than women, UK white colleagues are paid more than ethnically diverse colleagues and colleagues without long-term health conditions or disabilities are paid more than those with them).
In the case of the Median Gender pay gap this is reversed; here women are paid more than men.
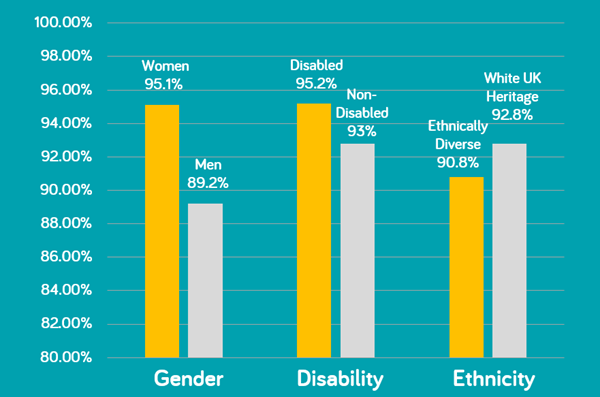
The smallest group of colleagues receiving a bonus payment were male colleagues (with 89.2% of men being paid a bonus in the 2023 period). The largest group was colleagues with a disability or long-term health condition (with 95.2% of these colleagues receiving a bonus payment), followed closely by female colleagues (with 95.1% of these women receiving a bonus payment).
| Bonus | |
|---|---|
| Women | 95.1% |
| Men | 89.2% |
| Disabled | 95.2% |
| Non-Disabled | 93% |
| Ethnically Diverse | 90.8% |
| White UK Heritage | 92.8% |
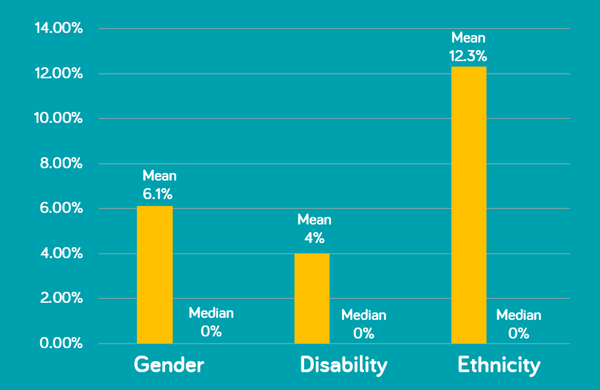
For 2023 there remains to be no Median bonus gap (0.0%) within any of the completed reports. The smallest Mean bonus gap relates to Disability (4.0%), followed by Gender (6.1%) and the largest gap is in terms of Ethnicity (12.3%).
The calculations for our overall bonus gaps include data for Cube and Hive Homes, as these colleagues are paid by Great Places. These organisations offer a commercial bonus structure that is reflective of the wider sector they operate within. This is different to the bonuses offered in the Social Housing sector and directly impacts the bonus gap shown.
To create pay quartiles, we have listed the salary of every colleague in order and then split the list into four equal parts to give pay quartiles. Salaries increase from quartile 1 to quartile 4. Below is the summary of our colleague demographic in terms of the quartile pay bands:
| Quartile 1 | Quartile 2 | Quartile 3 | Quartile 4 | |
|---|---|---|---|---|
| Women | 45% | 50% | 62% | 45% |
| Men | 55% | 50% | 38% | 55% |
| Median Gap | Women paid 14.5% more than men | Women paid 1.9% less than men | Women paid 4.3% more than men | Women paid 4.8% more than men |
| Mean Gap | Women paid 7.9% more than men | Women paid 0.7% less than men | Women paid 2.3% less than men | Women paid 4.3% less than men |
| Quartile 1 | Quartile 2 | Quartile 3 | Quartile 4 | |
|---|---|---|---|---|
| Ethnically Diverse | 23.6% | 16.9% | 10.6% | 6.8% |
| UK White Heritage | 76.4% | 83.1% | 89.4% | 93.2% |
| Median Gap | Ethnically Diverse colleagues are paid 9% more than White UK Heritage colleagues | Ethnically Diverse colleagues are paid 0.9% less than White UK Heritage colleagues | Ethnically Diverse colleagues are paid 3.4% less than White UK Heritage colleagues | Ethnically Diverse colleagues are paid 10.5% less than White UK Heritage colleagues |
| Mean Gap | Ethnically Diverse colleagues are paid 4.4% more than White UK Heritage colleagues | Ethnically Diverse colleagues are paid 0.5% less than White UK Heritage colleagues | Ethnically Diverse colleagues are paid 1.3% less than White UK Heritage colleagues | Ethnically Diverse colleagues are paid 7.3% less than White UK Heritage colleagues |
| Quartile 1 | Quartile 2 | Quartile 3 | Quartile 4 | |
|---|---|---|---|---|
| Disabled | 18.8% | 19.8% | 13% | 8.2% |
| Non-Disabled | 81.3% | 80.2% | 87% | 91.8% |
| Median Gap | Disabled colleagues are paid 6.3% more than Non-Disabled colleagues | Disabled colleagues are paid 2.8% less than Non-Disabled colleagues | Disabled colleagues are paid 4.7% more than Non-Disabled colleagues | Disabled colleagues are paid 0.5% more than Non-Disabled colleagues |
| Mean Gap | Disabled colleagues are paid 2.1% more than Non-Disabled colleagues | Disabled colleagues are paid 0.9% less than Non-Disabled colleagues | Disabled colleagues are paid 1.7% more than Non-Disabled colleagues | Disabled colleagues are paid 0.9% more than Non-Disabled colleagues |
Great Places is committed to reducing our pay gaps, and ensuring they are reviewed annually. As an organisation we take equality, diversity and inclusion seriously with a clear strategy in place to embrace the value of our differences, creating a culture of inclusion and ensuring fairness for all of our people. Aligned to our EDI and our People Strategies, we will continue to create an environment that provides equal opportunities for all colleagues, irrespective of disability or long-term health conditions, to reach their career progression potential.
Over the next 12 months we commit to continuing our work on ensuring we have a fair and transparent pay process, by:
We will ensure we attract and recruit diverse candidates by:
We will work to increase the diversity of our leadership team by:
We will continue to create a culture of inclusivity that helps us to retain diverse colleagues by:

Matthew Harrison

